“ is not merely the ubiquitous factor in high school geometry problems; it is stitched across the whole tapestry of mathematics.” Robert Kanigel, American science writer
Flattening the circle
In the previous section, we imagined the circumference of a circle as the crust. We then cut it into many pieces so eventually the curved crust became flat. That is one way to transform the circumference into something flat, or straight, if you prefer. Recall we also referred to the unit circle as a number circle. Using that perspective, we simply thought about “flattening the circle” as if the circumference was a string around the circle that we could also straighten out into something like a number line. We will use that concept of straightening a circle in this section.
Hilly and not hilly
I like to run, and I enjoy half marathons. Two things present a challenge whenever I enter a half marathon: the 13.1-mile distance and the hills. These two challenges are easier to visualize using elevation charts. Elevation charts have the elevation on the vertical axis and the distance traveled on the horizontal axis. You can think of elevation charts as a scaled slicing along the course. Runners are used to viewing these charts to quickly identify how flat or hilly the course is. But, as math people, there is even more insight we can gain and appreciate. Figure 1 is the elevation chart for the Drake half marathon, one of my favorite races.

Notice we start at around 925 feet and there is a gradual uphill for the first 3 miles. Then we approach the only major hill for the course, which first goes down for about a mile and then up for nearly 2 miles. Overall, this race is quite flat. Contrast this elevation with the Nashville marathon in Figure 2, which is 26.2 miles.

Clearly, the Nashville race has a lower elevation but, more importantly, greater elevation change. In other words, the course has more hills. There is interesting math at play in these elevation charts. Let’s take a creative perspective of these elevation charts.
A special race
Recall our unit circle, or number circle, is a circle with radius equal to 1. We can now put this unit circle into action by focusing on the top half. Assume we are running a special race where the course covers the top half of the circle as shown in Figure 3. You would start at the far left and finish at the far right. Consider the view of this half circle as what the course appears in real life. In other words, it is the perspective of a spectator who is watching from the side.

This circle has a much steeper climb than my Iowa hills, so I will refer to this as a race up and down a mountain, albeit a perfectly round mountain.
It would be difficult for spectators to view the beginning and end of the race unless there is a flat tunnel through the mountain that they can travel to view the start and the finish without being required to climb up and down the mountain.
Given this setup, let’s review the distances you, the runner, and the spectator must travel.
What is the distance the spectators travel? They travel the diameter of the circle, which is 2 times the radius. This equals , or 2.
How far will you and the runners travel? You can view the results in Figure 4. Since the runners travel up and down the mountain, then their distance is half the distance around the circle of radius 1, which is , or about 3.14.

Notice if this was in miles, then you would be running about a 5 kilometer distance, or a 5k. However, the spectators would travel exactly 2 miles. Also, notice the spectators have a perfectly flat route through the tunnel while you run uphill in the first half and run downhill in the second half.
Our story in now set. Our goal is to draw an elevation map similar to what we saw for the Drake and Nashville races.
Creating an elevation map
We know the height of the circle represents the elevation, which is the -axis. What is the -axis? Remember the horizontal axis from the Drake and Nashville races is the distance traveled by the runners. However, for the unit circle, our horizontal direction is the distance from the beginning to the finish if you did not have to run up and down the hill. In other words, the spectators could travel a distance of 1 and they would be exactly halfway to the finish which is directly below the top of the mountain. But where would you, the runner, be after traveling a unit of 1?
You would follow the arc of the circle for 1 mile. Figure 5 is your position after reaching the 1-mile mark of the race.

Can you draw an elevation map for this race where the elevation is on the vertical axis and the distance you travel as a runner is on the horizontal? In other words, we will take the circle part and stretch it flat to be our -axis. Then, the -axis will measure the height of the runner’s position at that point on the circle.
How would you start drawing this map? One way is to first identify key points. The -value is 0 at the starting point since the starting point has elevation 0. The entire distance around the semicircle is 3.14, so we could write our scale on the horizontal as ending at 3.14. Notice we know the height at the ending point also. We end at the same elevation where we started, which is 0.
We now have our beginning and ending points. Do we know the halfway point? The halfway point between 0 and is , as shown in Figure 6. Notice that is also the peak of the race where the height is 1. Thus, after we have traveled the distance , we are at elevation 1 (mile).
This gives us the key points: the beginning, halfway, and ending points. If you were running this race, how would you describe the beginning of the race relative to just before the halfway point? Both points are before the halfway point, so both positions require running uphill. But which position between the start and the halfway point has a faster uphill climb?
I think you can tell that the elevation increases fastest at the beginning. Would you agree that the elevation slowly flattens at a steady rate? Simply follow the slope of the top half of the circle and what do you notice? If I was describing this race to another runner, my description would be that the race starts nearly straight up, gradually flattens as you go, and is perfectly flat at the halfway point. Of course, the route down is the mirror image of the route up.
Figure 7 has 3 possible elevation maps. All 3 curves start and finish with an elevation of 0. Halfway through the race, all 3 curves have an elevation of . Which do you think is the correct elevation map for this 3.14-distance race up and down a half-circle?
Notice the middle red curve is a straight line up and a straight line down. That doesn’t seem to fit since we want the elevation to increase faster in the beginning. The bottom orange curve has a smaller slope increase at the beginning but then increases faster as we approach the halfway point, which is the opposite of what we want. We can see that the top teal curve has the fastest increase in the beginning. Thus, the correct elevation map for our unit circle is the top teal curve.
Not surprisingly, when we converted the top half of a circle to an elevation map, it no longer is a circle. But this curve still resembles a circle. More of a “squished circle”. Why is it squished?
We already identified that if I consider the first half of the race, then I increased my elevation 1 unit. The distance I traveled is , or about 1.57. Notice the elevation can’t be a perfect circle because we only increase the elevation by 1 while the distance traveled on the horizontal axis is , which is more than 1.5. But it should feel like a “squished circle” where every step is less “steep” than the previous step. This is a property we refer to as concave down. In contrast, the bottom orange curve consists of two concave up curves.
Interpreting the elevation map
Let’s review what we accomplished when we created this elevation map. Our interesting conversion involved graphing how the elevation changes in the circle. We considered the original top half of a unit circle as an actual mountain to run from the view of a spectator. We converted the view from the spectator to a view the runner would care about. The runner is actually traveling along the path of the circle. The runner cares about the distance to be covered and the elevation of the course, including the change in elevation.
It may help to think of the unit circle as a “number circle,” which we discussed in our Foundation section. Remember we viewed a number circle like a number line except it measures round things. Thus, when we take the circle and flatten it so it becomes our -axis, it resembles a number circle even more.
When we flatten the circle, we remove the slope, or the change in slope. We bring back that property by making the vertical -axis the slope of the circle at that point. This is the same conversion we performed when we created an elevation map for a runner. From a math perspective, this conversion may seem merely an interesting exercise in identifying a property for a circle. But from a runner’s perspective, this conversion creates an elevation map that highlights the key component runners care about: the elevation and the change in elevation for the run.
We can summarize this by considering two perspectives: the spectator’s perspective and the runner’s perspective. The original circle would be the spectator’s perspective as they viewed what the course would look like. They would view the top half of a circle. But when we converted the half circle to an elevation map, we created the perspective runners care about. Now that we understand the motivation for the elevation map, let’s identify how we could draw the elevation map.
We have a reasonable sketch of the elevation map. We know the exact starting and ending points as well as the halfway point. We also identified it should be a concave down curve where the elevation increase will decrease as we approach the halfway point. But how can we connect the dots and create the exact curve for all points?
Creating the elevation map
Let’s start with the top half of a unit circle centered on an -coordinate plane. Notice the -coordinate left of center has negative values, but it does not represent negative distance. It is only a labeling scheme. More importantly, using the top half of a unit circle is an accurate picture of our race from an outside view. The only thing we are missing is being able to identify an elevation for the distance around the circle. In other words, as we travel on the unit circle, what is our elevation based on the distance we have traveled? Thus, if somehow we can bring that knowledge into our unit circle, then we accomplish our goal.

Let’s consider a random point P on the circle in Figure 8. If we connect the point P to the center of the circle with a straight line and then draw another straight line to the starting point at , we create an angle. If we have a protractor, we can measure this angle in degrees. But recall we also have another way we measure angles, and that is by using radians. I have mentioned that using radians is sometimes more practical than using degrees. Here is one such situation.
Assume the point P is the unique point in the race where the runner has traveled exactly 1 unit. This would be 1 mile if our unit is a mile. I’ll generally just refer to it as 1 unit to maintain a general solution, but you can think 1 mile if it helps. Our goal is to calculate the elevation of this unique point P. What does the elevation represent?
The elevation represents the distance this point is above ground. So, we can represent this distance by drawing a segment from this point straight to the ground. In math terms, this segment will be perpendicular to the -axis. Now, if we also draw a segment from point P to the origin, or point (0,0), we have created a triangle.
Let’s piece together what we know about the triangle. Since our elevation segment is perpendicular to the -axis, we have created a right angle. Thus, we can reap the benefits of working with a right triangle. The angle by the origin is the angle we just mentioned. It may seem that we don’t know this angle measurement. But we do know the distance the runner traveled is exactly 1 unit and that 1 unit arc is the arc created by our angle. Since we have a unit circle, which means the radius is 1, then the angle measurement is 1 radian. This is simply a definition. In other words, given a unit circle, an angle that measures 1 radian will produce an arc that has a distance of exactly 1 unit, which matches the length of the radius of the circle.
Speaking of the radius of the circle, the segment from point P to the origin represents the radius so its length is 1. Notice this also represents the hypotenuse for our right triangle. Thus, we know three parts to the triangle: two angle measurements and the length of 1 side.
The goal is to calculate the length of the side opposite the angle that measures 1 radian. In triangle language, we refer to that side as the “opposite side.” You may recall the formulas for right triangles. One formula uses an angle measurement for an angle that is not the right angle. The formula tells us that the sine of this angle equals the length of the opposite side divided by the length of the hypotenuse. Since the length of the hypotenuse is 1, this simplifies to the sine of 1 radian equals the elevation as illustrated in Figure 9. We used this sine function property earlier in Lazarus Math when we measured the distance around a circle.

Now you may think we are stuck here because we just defined a 1 radian angle measurement based on the length of an arc. But you may be thinking we need a degree measurement to finish this problem. That’s not a problem because we know there are 360 degrees in a circle. We also know the distance around a circle is . Since the radius is 1 for a unit circle, this simplifies to . Thus we have the relationship that radians equals 360 degrees. We can solve for 1 radian by dividing both sides by . Thus, 1 radian equals . So we can calculate the elevation in degrees using . Or, if the calculator supports radian angles, convert our calculator to radian mode and calculate radian. Either way, the elevation height for point P is 0.8415.
While we’re at it, we can calculate the other length of the triangle by using the cosine function. The cosine of an angle is the adjacent side divided by the hypotenuse. Since the hypotenuse is 1, represents the length of the base of the triangle. Its value is 0.5403 as we see in Figure 10.

This distance travels left of the -axis, which makes its position on our -coordinate system negative. Thus, the -coordinate value is -0.5403.
Now consider this question. If you had a spectator that paced themselves such that they were always at the point directly below you as you ran, how far would the spectator have traveled when you are at the 1-mile mark?
The spectator’s total distance from the beginning to the halfway point is 1 and they are 0.5403 away. That means they have traveled 1-0.5403 or 0.4597 miles. Notice you, the runner, have traveled more than twice the distance as the spectator when you arrive at point P. However, that ratio doesn’t continue for the entire course. We know this because you travel 3.14 for the entire course and the spectator travels 2, which is less than a 2 to 1 ratio. Of course, the reason is your course flattens around your 1-mile mark and continues fairly flat for about another mile.
What are our takeaways? I have 4 primary reasons for sharing this story.
4 Takeaways
The first reason is to appreciate the radian measure for angles. I should give the disclaimer that the normal convention when viewing the unit circle is to start at the point and then move counterclockwise. Notice this is different from our running example where we started at and went clockwise. It will be easier to be consistent with convention, so we will use this convention in the future, but it is only a convention.
The bigger question is: why use the radian measure? We reviewed an example if the angle measurement is 1 radian. Let’s review our radian measurement further because it is a key concept.
If I give you an angle measurement in degrees, say 45 degrees, what is the distance traveled on the unit circle that connects this angle? This would be a difficult question if we started from scratch because we are measuring round things. But, since the distance around a circle is simply the circumference and we remember that our all-star formula for the distance around a circle is , then this simplifies to for a unit circle. Since there are 360 degrees all the way around the circle, there are 180 degrees halfway around the circle. Thus, 90 degrees represents 1/4 the distance around the circle and 45 degrees represents 1/8 the distance around the circle. That means the measurement for the length of this arc is simply . We can conclude that the radian measure of a 45 degree angle is . Now when we use radians as our angle measurement, the result is not just some arbitrary number like 45, but it is a meaningful number connected to the angle itself.
You and I do this all the time without knowing it. Let’s imagine you decide to run from your home to the ice cream shop and back. When you get to the ice cream shop, you do some mental math to consider how far you have gone and how much of your journey you must complete. You may think about the distance you’ve traveled in miles or the number of minutes you traveled. But the simple perspective is to realize that if you return the same way you arrived, you are halfway done with your journey. Thus, you have created a new unit of measure for your trip. You consider the round trip to the ice cream shop from home as 1 unit and you are 50% of the way there.
The point is that when we use radians as a measure rather than degrees, we are just converting to a unit that is easier to understand for the problem at hand. There is no correct unit but it can be useful to be comfortable using multiple units so you can choose the unit that is easiest for the given problem. Therefore, we often prefer to use radians to measure an angle because an angle of 1 radian represents a distance of 1 around a unit circle. Certainly, we often consider circles that have a radius other than 1. But we can use the unit circle as a starting point. Usually, everything scales from the unit circle to another circle by a constant. Thus, developing a strong understanding of the unit circle is a powerful way to solve a wide range of math problems. There are other benefits for using a radian measure that is connected to the unit circle, but this is the most obvious benefit.
This can be a key ingredient to help make your math come alive. Too often we view math notation as complicated. It can seem complicated if we view it as just one more thing to remember. In this example, we’re often testing students on how to convert degrees to radians or radians to degrees. Thus, it is perceived as one more formula to memorize. Usually, students don’t understand the reason for the conversion, so it becomes another rote memorization and it feeds the idea that math is just complicated.
Rather than testing the idea, why don’t we explain the reason for the idea? In short, these notational ideas get in the way of our math coming alive. Try to see the reason for the notation and appreciate the value that we get from the notation. Ironically, understanding the reason for something is also often the fastest and easiest way to learn or memorize something. Once we understand the reason for the radian measure, there is nothing to memorize, assuming you already know the formula for the circumference of a circle.
The second reason why we considered this story is to identify a label or a name for our elevation map. Think about how we derived the elevation. The input was the distance traveled, which, when measured on the unit circle, is the same as the angle measurement in radians. The output is the elevation.
Remember we calculated the height on the unit circle as the sine of the angle. As a result, we can interpret our elevation map as the sine function where the input is the distance traveled on the unit circle and the output is the height of the point on the unit circle at that distance.
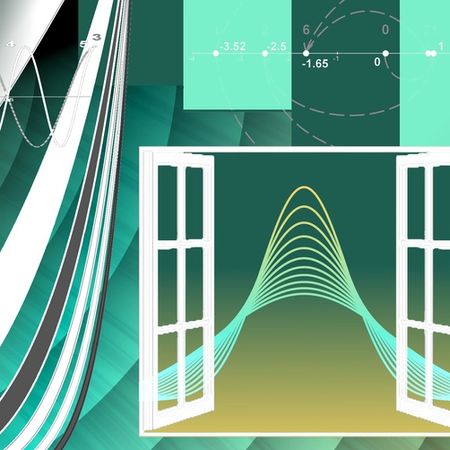
Notice both the sine elevation map and the unit circle identify how high the curve (mountain) is at any given point. The only difference is the unit circle is from the perspective of the spectator as they walk through the tunnel along the -axis and the sine elevation map is from the perspective of the runner actually running along the curve. We identified the sine curve is not a perfect circle but more of a squashed circle. It actually feels more like a wave. In fact, we refer to this as the sine wave.
We considered only the top half of the circle. We can complete the circle by considering the sine wave for the bottom half. Because the bottom half of the circle is a mirror image of the top half, we should expect the sine elevation map for the second half of the circle to mirror the first half, only below the -axis. Figure 11 is the complete sine curve relative to the angle measured, which is the distance traveled from 0 to along the entire unit circle.
I think this ability to view the same thing from two different perspectives, and to understand both perspectives, is an excellent opportunity to stretch our empathy muscle since empathy is all about seeing things from other perspectives.
The third reason is to give context and fresh insight into the unit circle. Not only can we use the unit circle as a starting point to understand circles with different radius lengths, but the unit circle can be an incredibly powerful tool for understanding complex problems not directly related to a circle. Some problems involving the sine and cosine can be solved by only using triangles. However, it is helpful to have your perspective be that the sine and cosine originate from the unit circle, so you will always have the big picture. Many problems involving the sine and cosine require the context of the unit circle. It is easy to identify triangles within the unit circle, if needed. In short, we can understand most of trigonometry by using a unit circle as a starting point to creating triangles.
Since we’ve come this far, let's take a small additional step to interpret the cosine function, which is our fourth reason. The sine function measures the height of the point on the unit circle. The cosine function measures the distance to the -axis.
Direction is important here. Consider height as positive in the first and second quadrants where the circle is above the -axis. Thus, the sine function is positive in these two quadrants.
The cosine is positive in the first and fourth quadrants since values in these quadrants have a positive -value.
If the sine function gives us the elevation map, what does the cosine function give us? Since the cosine measures the shortest distance to the -axis, we can label the cosine function as the distance map to the -axis as we travel around the unit circle. If you like the mountain race analogy, the cosine function measures how far the spectator is to the halfway point, assuming the spectator is directly below the runner. A negative distance means the spectator has not passed the halfway point, while a positive distance means the spectator has.
Because the circle is symmetrical, there is a close relationship between the distance from the -axis, the sine function, and the distance from the -axis, the cosine function. For both distances, we always want the shortest distance to the axis. Thus, it shouldn’t be a surprise that the cosine function is similar to the sine function except it is shifted by to the left. If you think about it, this should make sense. If you can imagine rotating a circle of a turn, which is , then the distance across becomes the distance up or down and vice versa. This is an example where viewing the sine and cosine from a unit circle has its advantages. To me, it is not clear from a triangle that the sine and cosine are the same concept just rotated or shifted. However, it is easy to see that perspective from a unit circle.
Wrap Up
We invested significant time and effort on this story. We are often given simple formulas to memorize which can be efficient. But there are some concepts, such as angle measurement, where it is important to understand how we derived the formulas and the context for the formulas. This will make it easier to understand the concepts compared to just memorizing formulas.