“Mathematics, rightly viewed, possesses not only truth, but supreme beauty—a beauty cold and austere, like that of sculpture, without appeal to any part of our weaker nature, without the gorgeous trappings of painting or music, yet sublimely pure, and capable of a stern perfection such as only the greatest art can show.” Bertrand Russell
Something bigger
My favorite and most productive time to write is early in the morning. Usually, it’s dark when I start, which works best for me. Then, if it’s not too cloudy, the sunlight streams in through the window after a while. How much sunlight I see through my fairly narrow window varies depending on the season. For most of the year, there is about a 15-minute period when the bright sunlight hits me directly, making it difficult to focus. However, even though the bright light makes it difficult to read, I fondly enjoy that time because it’s a reminder of something bigger and more beautiful.
Let there be light
We calculated distance around a circle as an exercise in one-dimensional curvature. Next, we moved to two dimensions and calculated the area of a circle. Lastly, we dissected the unit circle and identified the sine elevation map.
Now, we continue to increase the dimensions and consider how two big spheres interact. The spheres are the sun and the earth. In particular, we want to understand how much sunlight we receive each day.
Among other things, the amount of sunlight depends on where you live and the time of year. We have the complicated process of the earth revolving around the sun while spinning on its axis. The earth revolves around the sun in an elliptical pattern. There’s a lot of math going on with all this. What I want to focus on is not the cause for the amount of sunlight, which is a much larger topic, but just what we observe. How much sunlight do we receive each day?
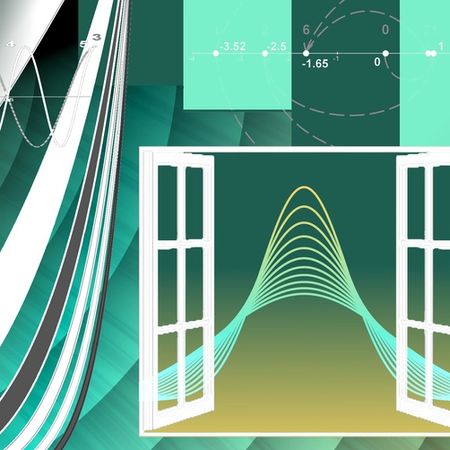
To answer how much sunlight we observe on a given day, we need two primary input data. The first is where we live on the earth. In particular, our latitude. Remember latitude gives us the lines that run east-west, parallel to the equator. From my location, Figure 1 is an approximate model of the amount of light I receive.

First, does the shape of the curve appear familiar? It should resemble the sine elevation map we just reviewed. In fact, the graph of the number of hours of sunlight each day is a sine curve. It is not the same sine curve from the unit circle, but it is a curve created from the sine function. At first thought, it doesn’t seem like we should get the same type of graph for the number of hours of sunlight we get in a day as we do when we graph the elevation of our climb up and down the unit circle. Let’s understand how these graphs differ and how they are similar.
For the graph of the hours of sunlight, we have time on the horizontal, not distance traveled. Specifically, the day of the year is on the horizontal axis and ranges from 1 to 365. Day 1 is January 1, and day 365 is December 31. The vertical axis is the number of hours of sunlight for that day rather than elevation. Everything here is an approximation, so we ignore details such as leap years.
I mentioned this graph models the sunlight hours based on my location. You may wonder about the daylight graph at other locations, such as the equator. Figure 2 is a similar graph where the dashed line represents the amount of sunlight at latitude 0 (equator).

Of course, the graph for the equator isn’t very interesting as it is a constant 12 hours of sunlight per day.
You may also wonder about the hours of sunlight for a location the same distance to the equator as my location except south of the equator. The graph for this location is similar to the graph for my location except it is a mirror image reflected over the equator sunlight graph. That means if I have 13 hours of sunlight, the location south of the equator has 11 hours of sunlight, and vice versa.
What do you observe regarding the number of hours for my location?
Observations and Seasons
Let’s identify the extreme points. The first day of the year (January 1) has a near minimum with 9.0 hours of light. The minimum occurs later in the year on day 355 with minutes fewer than 9 hours of sunlight. This day that has the minimum hours of sunlight begins the winter season.
Likewise, the day with the most sunlight is on day 172 with minutes more than 15 hours of brightness. This marks the beginning of summer.
We’re only seeing the curve for 1 year, but the curve remains fairly constant each year for a given location. Let’s view the curve in Figure 3 by syncing it with the sine elevation map of the unit circle, which means we start halfway between the highest and lowest elevations.

The equivalent starting point is at day 81 where we have 12 hours of sunlight. Then we end the year 365 days later. Note that day 81 and day 446 are approximate starting dates for spring.
In our sine elevation map, we identified some properties of how the function increased and decreased over time. Recall the race started with the steepest climb and then it gradually leveled off as the course approached the halfway point. For our sunlight graph, the turning point of the curve occurs approximately when summer begins. That means the sharp increase in the curve at the start of the race is equivalent to the sharp increase in the sunlight curve at the start of the spring.
Since both are sine curves, we can expect them to have similar properties regarding the slope. Notice the slope for this curve is steepest at the beginning and levels off as we approach summer. How can we interpret this curvature? Since the horizontal axis represents the days of the year that are equally spaced out, a faster increase in the curve represents the number of hours of sunlight per day is increasing faster than when the slope is flatter and closer to summer.
That indicates the hours of sunlight per day increase fastest at the beginning of spring and gradually slows down until summer begins. Once summer begins, then the days get shorter and our sunlight per day decreases. Because the slope down is a mirror image of the slope up, then we only have a small decrease in sunlight at the beginning of summer. However, as we approach autumn, the curve is decreasing at its greatest rate. Then, once autumn begins, the days continue to shorten but at a slower rate. The change in rate is subtle at first but becomes significant as we approach winter. Then the days start getting longer, and we get more sunlight than we do on the first day of winter.
Order or chaos
For me, a picture is worth a thousand words. This picture makes it easy for me to understand how the hours of daylight changes for an entire year. Now, when the sunlight shines on me in the morning, I think about what day of the year we are at and I picture how the hours of sunlight will change in the coming days.
Perhaps you find this not only fascinating but comforting. I realize we are all wired differently. It is easy to feel like our world is out of order. All we have to do is listen to the media and we get a picture of a world out of control. I prefer to focus on the quiet signal of order in the world which we enjoy each day as the sun shines on our lives. We may have people issues to deal with, but the sun and the earth are rotating and operating just fine. Not only can we be confident the sun will rise tomorrow, but we know the exact time the sun rises and sets.
The order we find from the hours of sunlight each day is just a small sample of the order we see in math. As we have explored the dimensions of distance around and area within, we have found order in the simple shape of a circle. The hidden factor in this order is the mysterious yet infinite . Again, isn’t it amazing that the distance around a circle is always times the distance around the circle? We know much about , even though it has an infinite number of digits that never repeat. But stating that has an infinite number of digits is just the beginning of our journey into the depths of infinity.
There is so much math in this infinite space. This trail of numbers never end but actually equal something exactly. Exploring the infinite is the focus for our next main topic. It is large enough that we do it in two parts: Expanse 1 and Expanse 2. There are some amazing stories to be told as we journey into the world of the infinite. I hope you will join me.